A Library Management System (LMS) is a digital solution designed to streamline the operations of a library, including book cataloging, user management, book issuance, and return tracking. By using Data Flow Diagrams (DFD), we can visualize how data moves through the system, making it easier to optimize and manage workflows effectively.
What is a Library Management System?
A Library Management System is an automated software that helps manage books, members, and transactions within a library. It simplifies tasks such as book issuance, returns, reservations, and record-keeping for efficient operation.
Key Features of LMS
- User Management – Registering and managing users (students, faculty, librarians, etc.)
- Catalog Management – Adding, updating, or removing books.
- Overdue Tracking – Notifying users of overdue books.
- Reports & Analytics – Generating reports for library usage.
Understanding Data Flow Diagrams (DFD) in LMS
A DFD is a graphical representation that illustrates how data flows through a system. It consists of external entities, processes, data stores, and data flow arrows. Different levels of DFD provide varying degrees of system detail.
Components of a DFD
- External Entities – Users or systems interacting with the LMS.
- Processes – Operations such as issuing a book or adding a user.
- Data Stores – Places where data (books, users) is stored.
- Data Flow – Movement of data between entities, processes, and stores.
Level 0 DFD
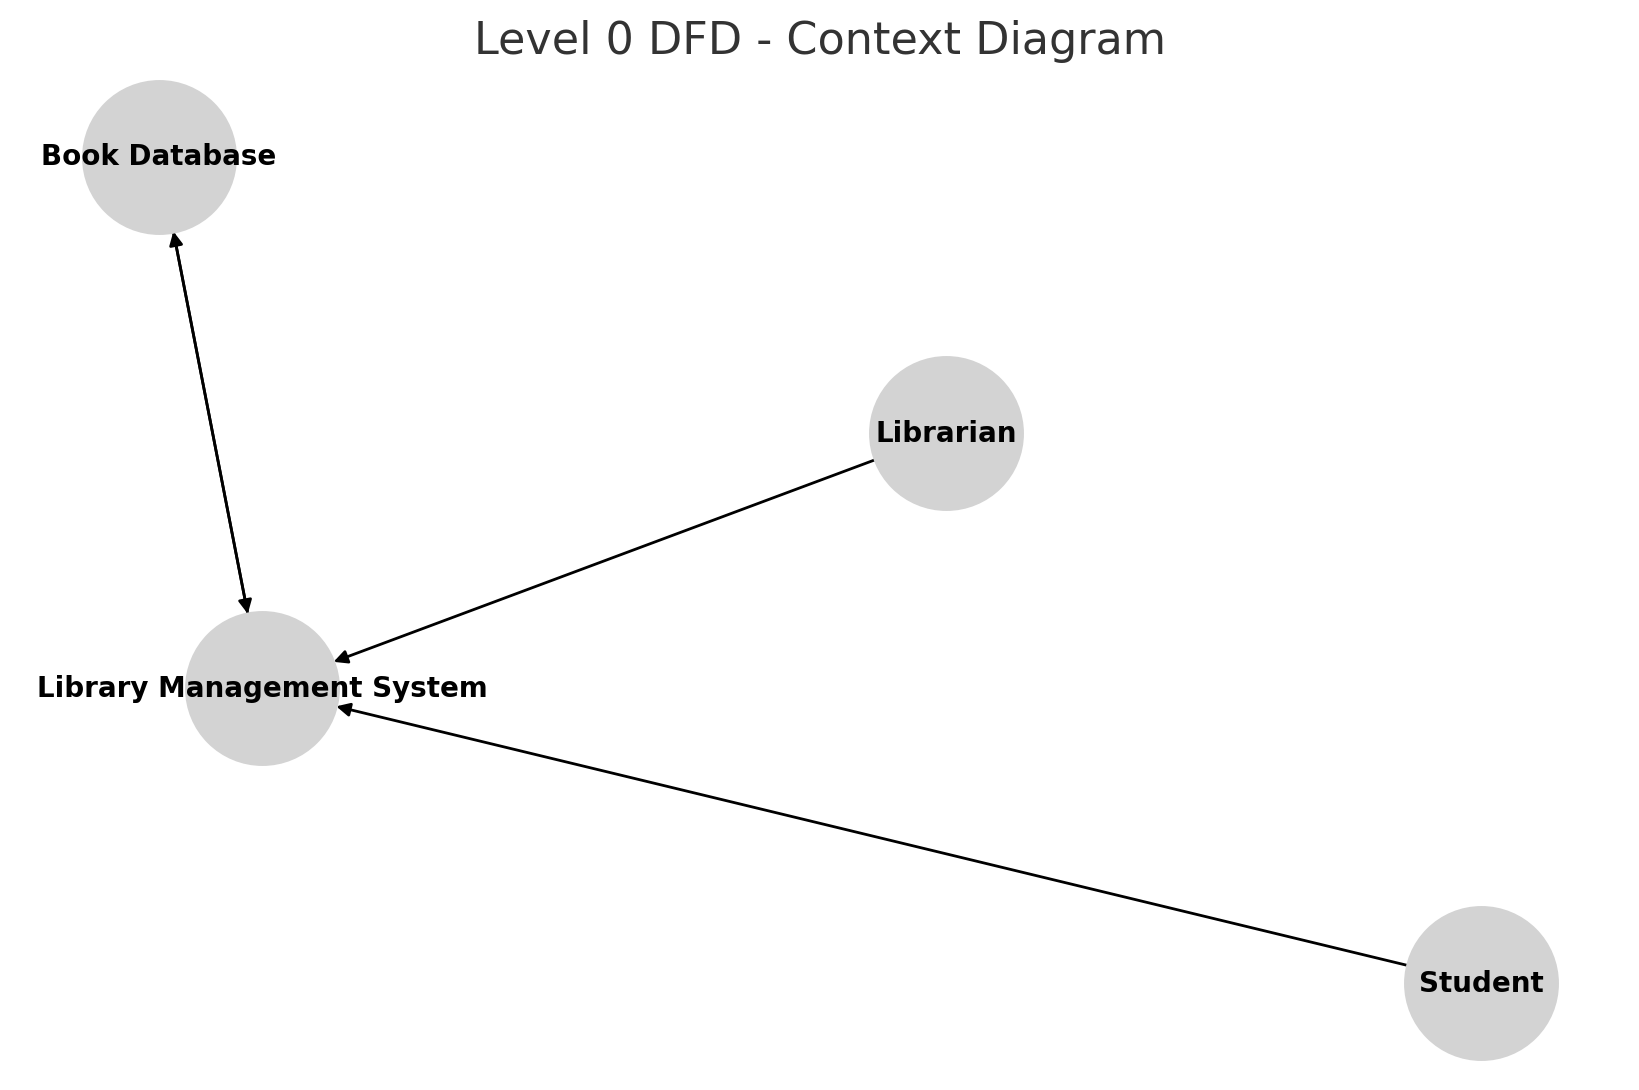
The Level 0 DFD, also known as the Context Diagram, represents the entire LMS as a single process. It shows the interaction between the library system and external entities.
Entities Involved:
- Librarian
- Students
- Book Database
Processes:
- Borrow/Return Books
- Manage Users
- Update Catalog
Level 1 DFD
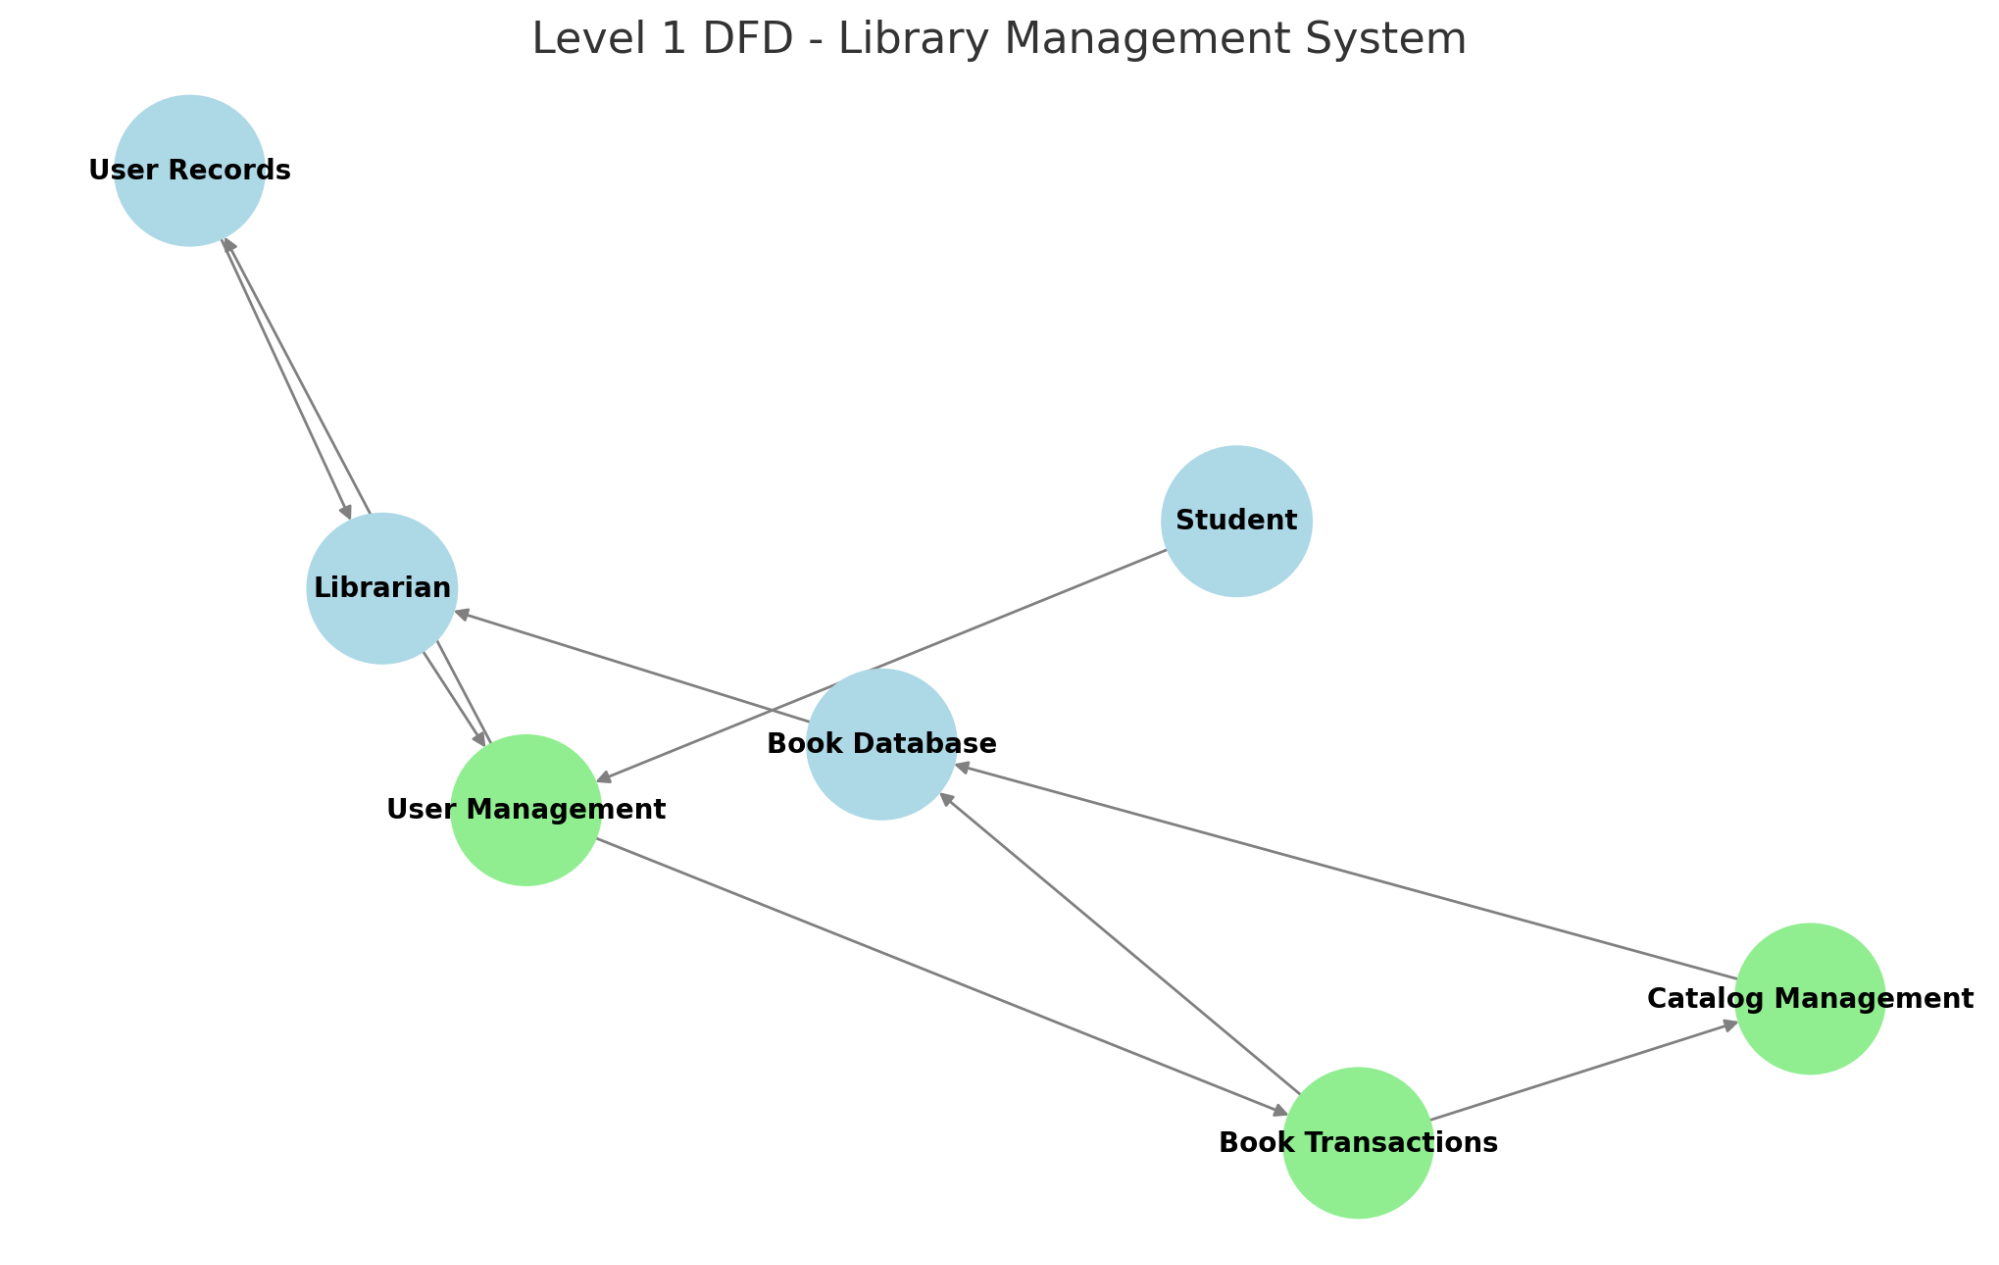
The Level 1 DFD expands on the primary processes within the system, dividing them into major functionalities.
Main Processes:
1. User Management
- Add/Edit/Delete Users
- Validate User Login
2. Book Transactions
- Issue Books
- Return Books
- Reserve Books
3. Catalog Management
- Add New Books
- Update Book Details
- Remove Books
Level 2+ DFD (Detailed Breakdown)
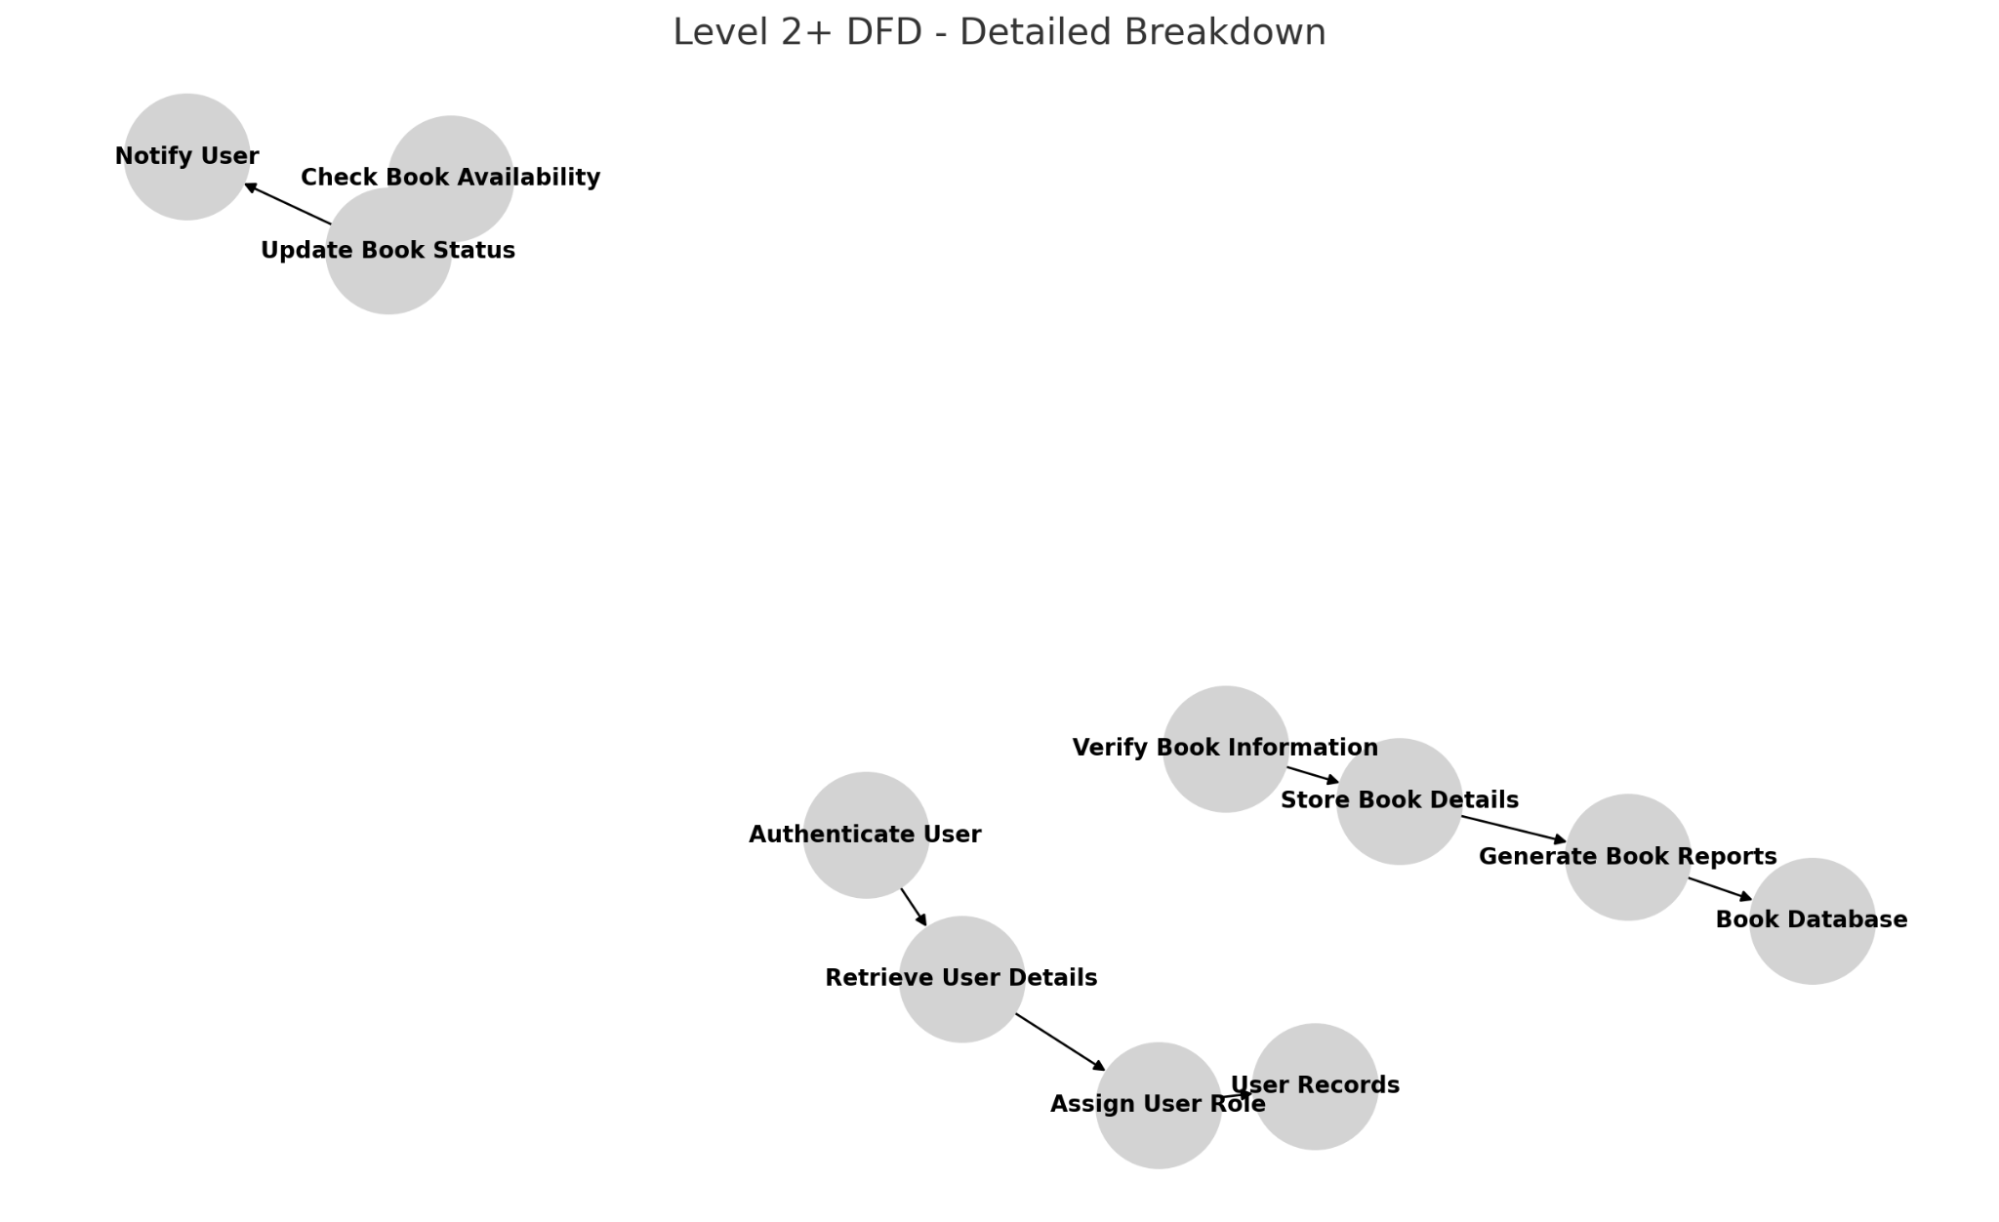
The Level 2+ DFD provides a detailed breakdown of the sub-processes within the LMS.
Detailed Sub-Processes:
1. User Management:
- Authenticate User
- Retrieve User Details
- Assign User Role
2. Book Transactions:
- Check Book Availability
- Update Book Status
- Notify User
3. Catalog Management:
- Verify Book Information
- Store Book Details
- Generate Book Reports
Graphical Representations
To better understand library trends and usage, graphical representations such as bar graphs and pie charts are helpful.
1. Book Borrowing Trends
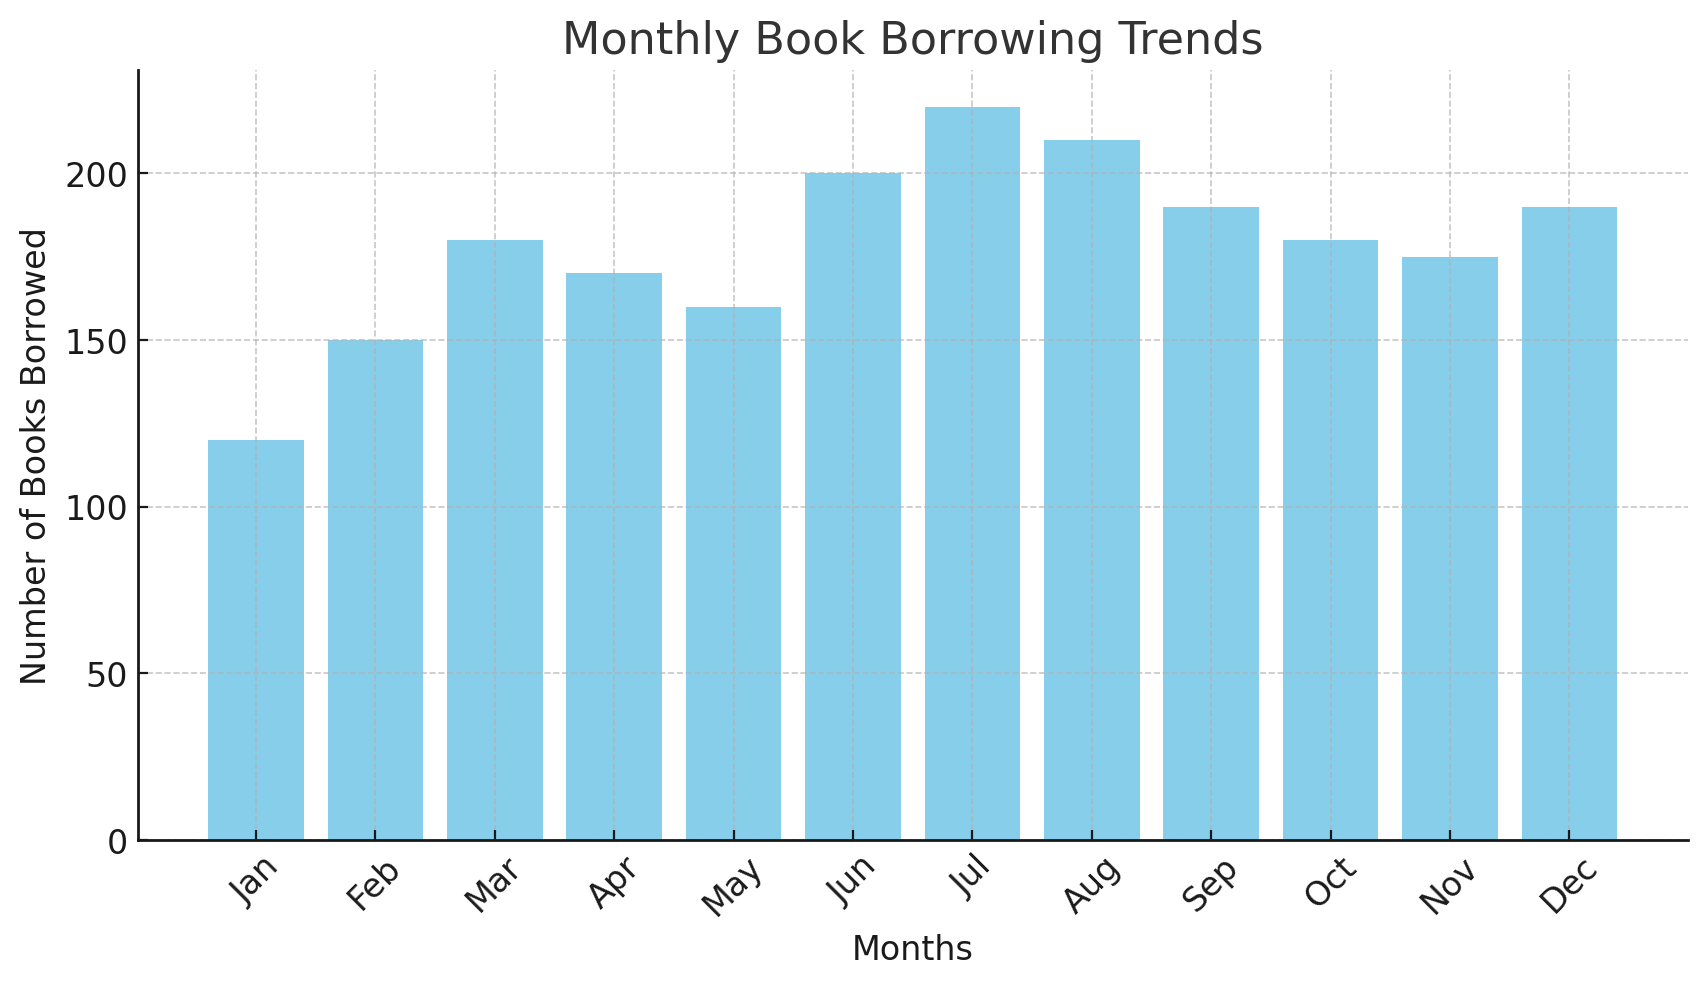
A bar graph showing monthly book borrowings:
2. User Categories Distribution
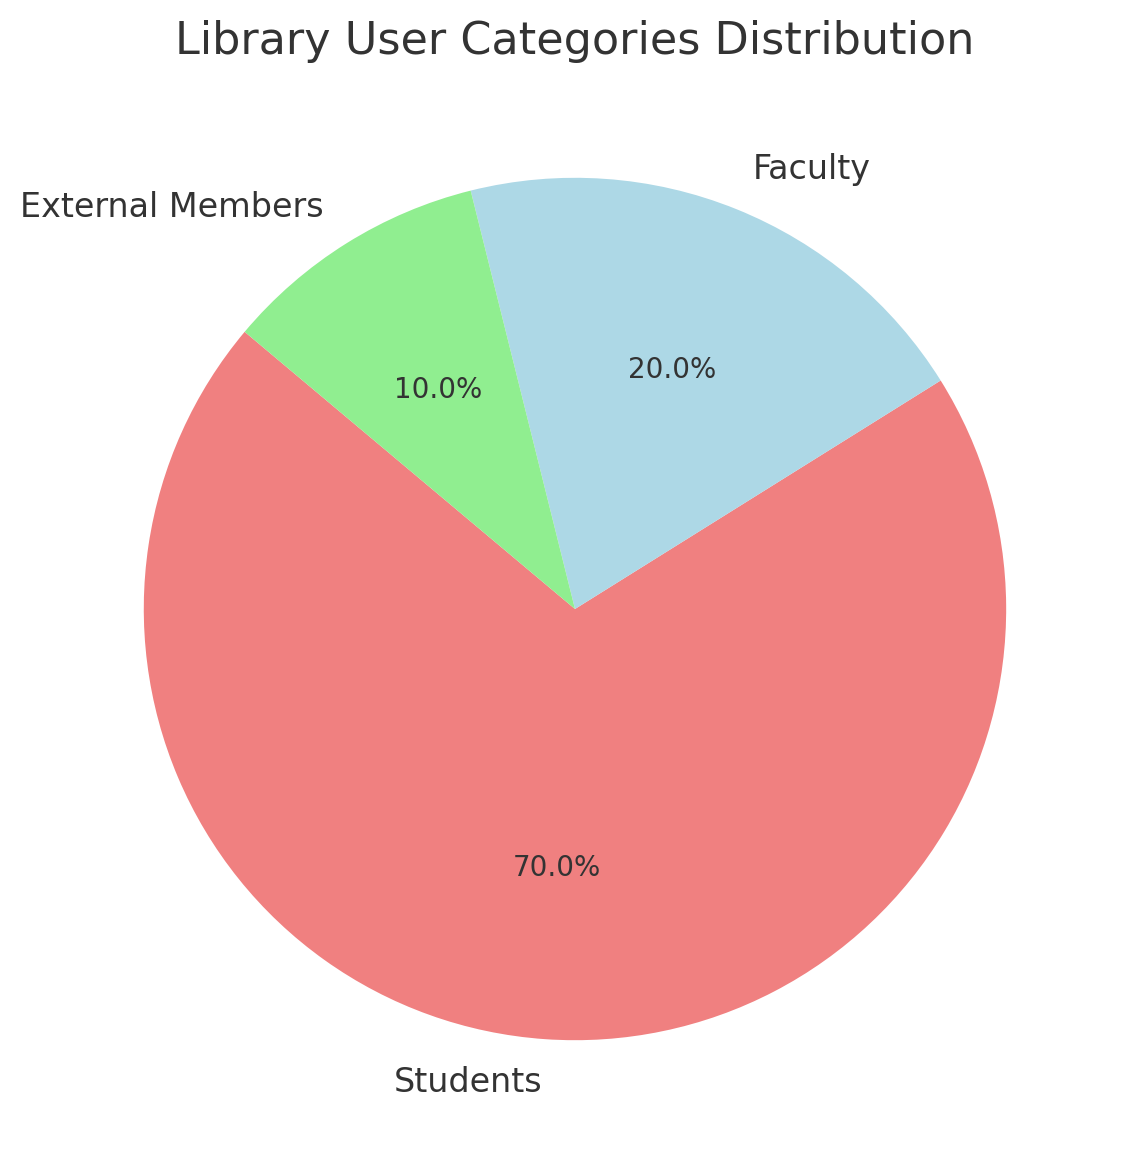
A pie chart displaying the distribution of students, faculty, and external members:
3. Overdue Books
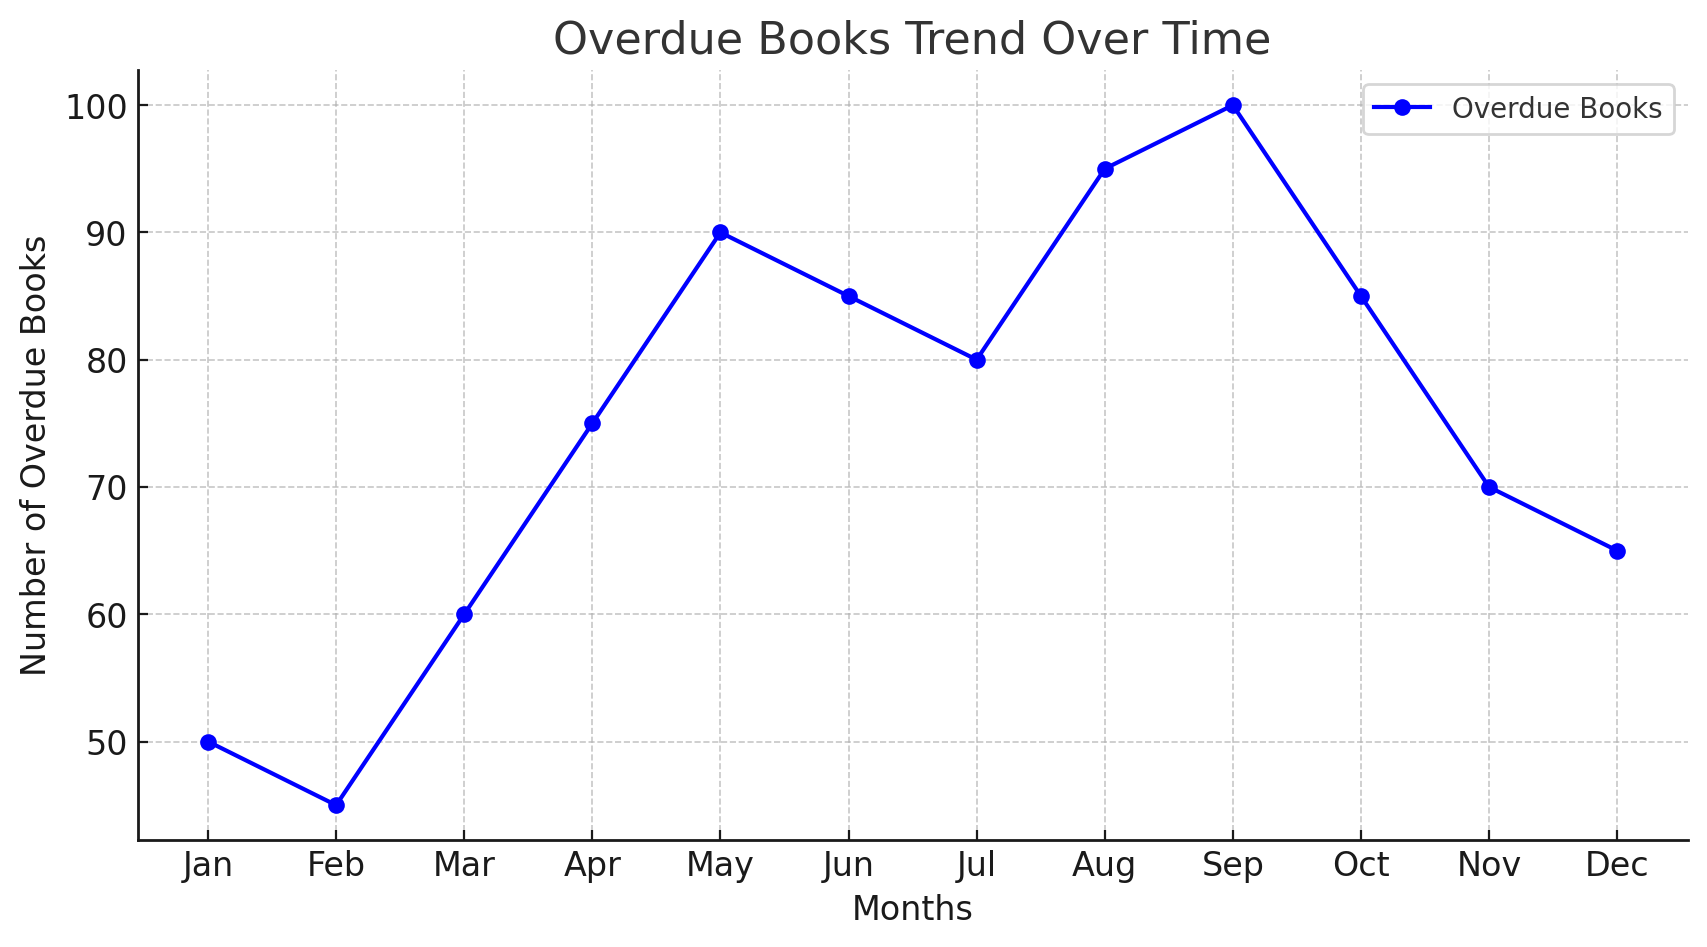
A line graph illustrating overdue books over time:
Benefits of LMS with DFD Implementation
1. Efficient Data Management
DFDs help libraries visualize workflows, making it easier to manage data efficiently.
2. Improved Decision Making
With graphical analysis, librarians can track book borrowing trends and overdue books, helping in better decision-making.
3. Enhanced User Experience
A well-structured LMS ensures smooth interactions for students, faculty, and librarians.
4. Better Resource Utilization
DFDs help in identifying process inefficiencies, enabling libraries to optimize resource allocation.
FAQs
Conclusion
A Library Management System plays a crucial role in organizing and streamlining library functions. By leveraging Data Flow Diagrams (DFD), stakeholders can visualize system workflows, optimize processes, and ensure efficient library operations. Graphical analysis further enhances decision-making, ensuring an optimized library experience for all users. Implementing these structured approaches guarantees an efficient, well-managed, and user-friendly library system.